Introduction

Hi, Mohammed Azeem here,
I have always wanted to work in a real environment and experience it for myself, and this enthusiasm led me to study for a bachelor's degree in mechanical engineering. After graduation, I worked with Toyota, one of the well-known companies in the automotive industry. have always followed the technological advancements around me, whether it's any new smartphone or laptop in the market, I always dive into the specifications to understand the key differences. The desire to understand how things work and the meaning of specific technologies has always made me challenge myself, and continue to learn and develop in my personal and professional life.
It is at my previous job at Toyota which enabled me to learn a lot about the business, technology and standardization of the industry. One such project that caught my attention was the use of machine learning techniques for predictive maintenance . Working closely with data and monitoring anomalies through data has made me more and more interested in this technology, and have been paying attention and learning since then. Would love to pursue my career in this field where I can utilise my transferable & technical skills to solve real-world problems.
Have good hands-on experience in Python, Data Analysis, foundations of Machine Learning algorithms, Statistics, mathematics, model training using Azure ML studio & understanding of complete Machine Learning pipeline. To know more about my work please, check out my professional work.
Currently I am working as a Business Analyst at an Analytics Solutions company as a Power BI Developer . Have developed dashboards via capturing client requirements & representing their data in an insightful dashboard visualization to help them draw business decisions.
End-End ML Project
Automotive price Prediction
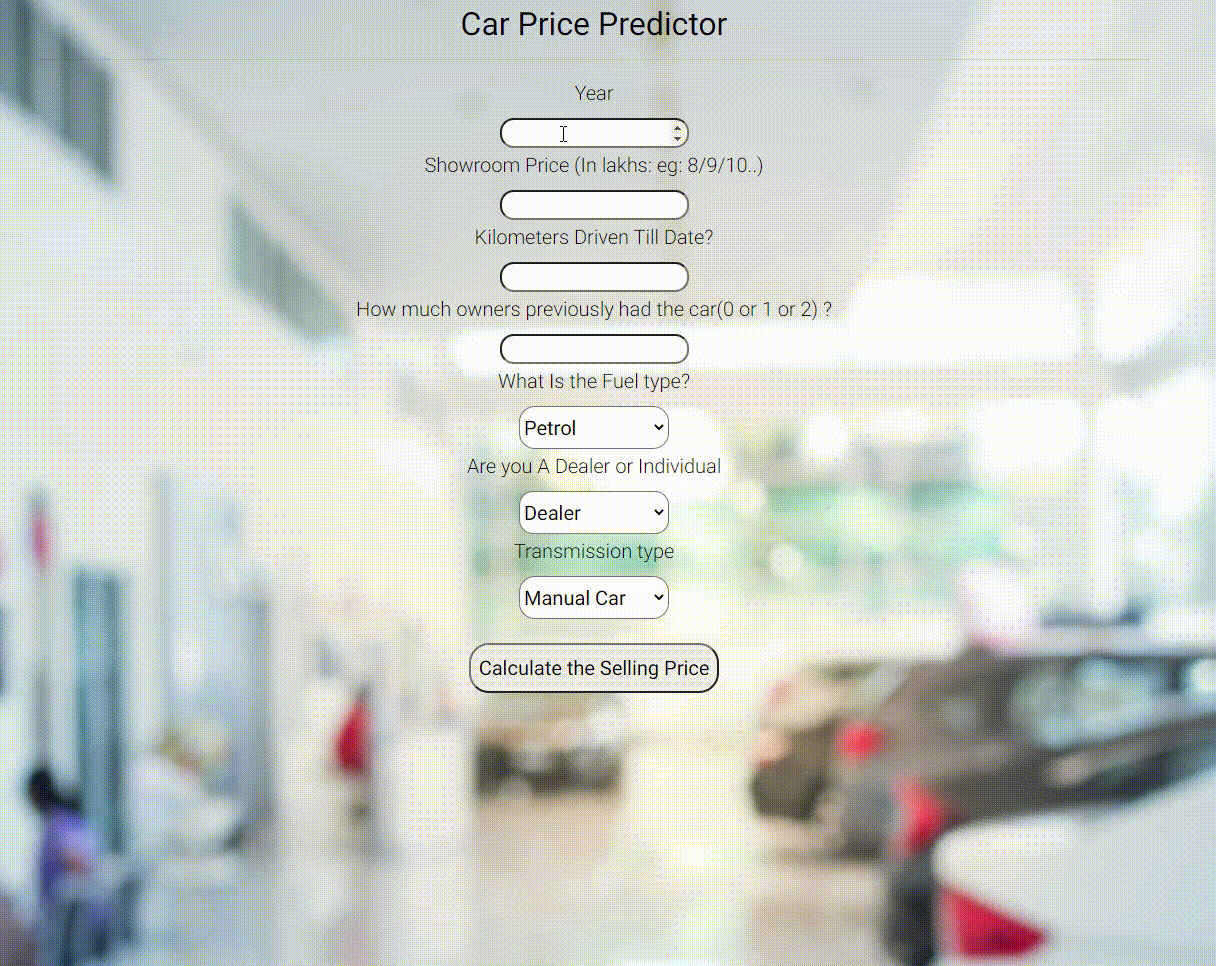
Click the image for live interaction
Problem Statement
The main aim of the project is to use Machine Learning to predict the resale value of the car using various features such as 'Year', 'Km Driven', 'Fuel Type' etc.
Solution
The Dataset contains information about used cars listed on cardekho.com hosted on Kaggle.com. The dataset is loaded & exploratory data analysis with some visualization is performed to find the outlies, missing values, feature correlation etc. to fianlise the dataset. Random Forest Regressor with RandomizedSearchCV gives the best results, where R2 Score = 0.87 ~ 87% . The Trained model is then deployed using Heroku cloud application platform
for more details on code & deployment, please visit this GitHub Repository .
Visualization Projects
Power BI - Sales Data
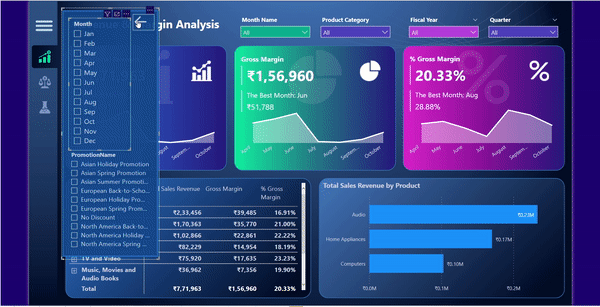 Problem Statement
The main aim of the project is to use power BI dashboard for the data to uncover business insights. Concept of bookmark is used to give UI the look of a website where, user can navigate between pages using the left menu.
Success Criteria
Interactive Power BI Dashboard uncovering the sales order insights which helps in making insightful data driven business decisions.
AtliQ- Sales Insights Data Analysis
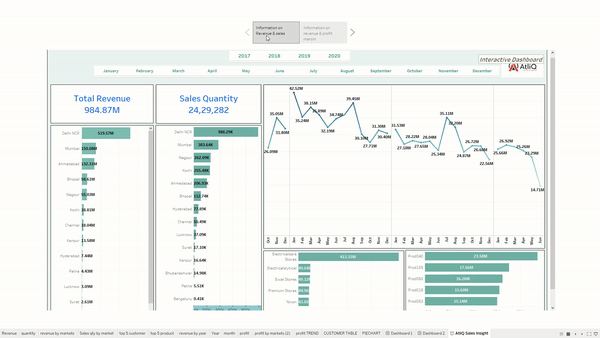
Click the image for live interaction in Tableau Public
Problem Statement
The main aim of the project is To understand the sales insigts that are not visible before for the sales team to help in decision making & automate the task in to reduce the time spent in gathering data.
Success Criteria
Interactive Tableau Dashboard uncovering the sales order insights which helps in making insightful data driven business decisions.
for more details to the project, please visit GitHub Repository .
HR Data Analysis
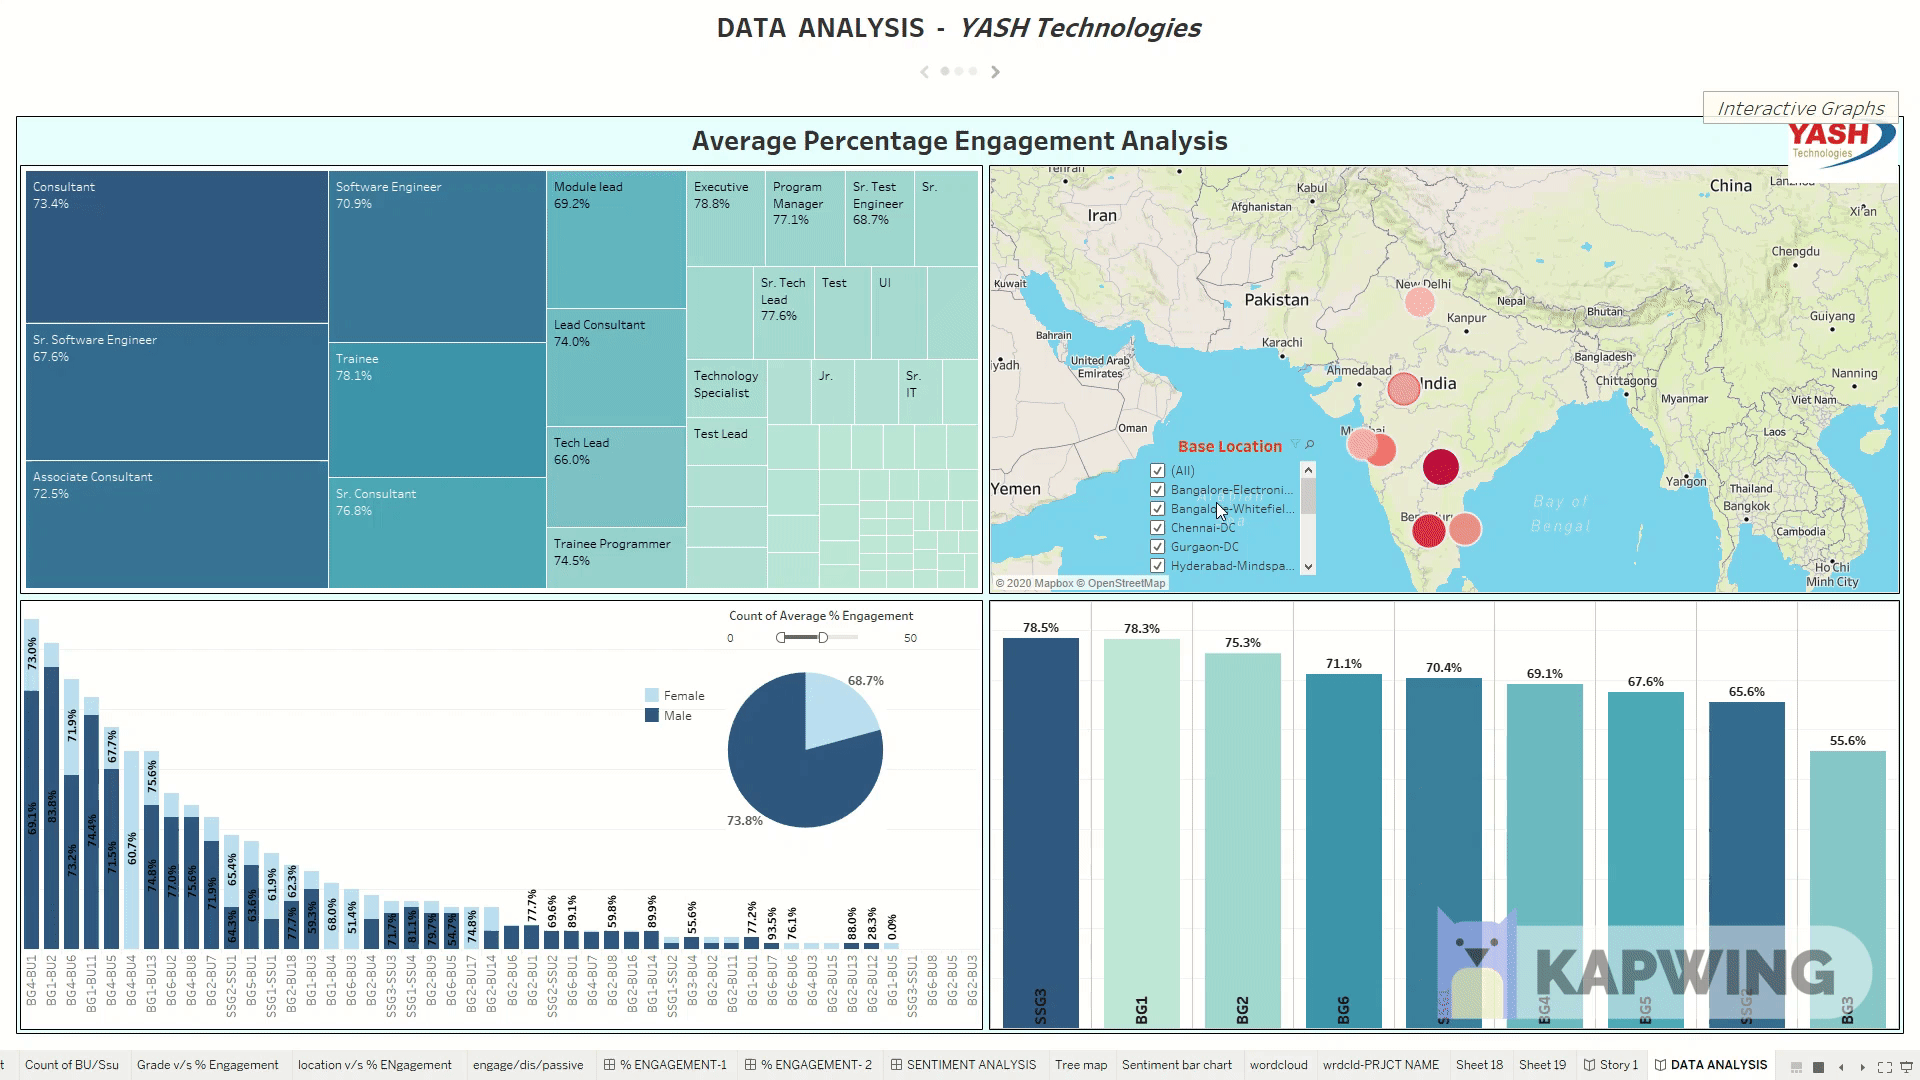
Click the image for more information
Problem Statement
The main aim of the project was to create an interactive dashboard for the HR Data, to find the percentage engagement of the employees & also perform a sentiment analysis via the reviews provided by the employees to take data driven insightful decision to increase the overall satisfaction of the employees.
Solution
Tableau Desktop & Python were used to build this dynamic dashboard
for more details & other similar projects, please visit Tableau Public .
Global SuperStore Data Analysis
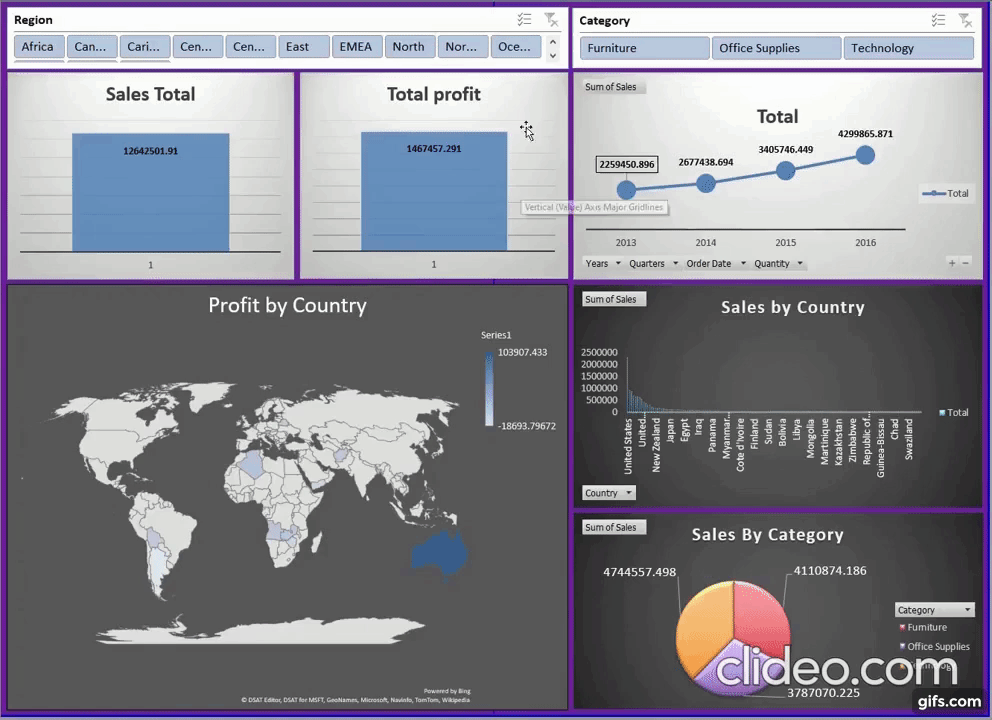
Click the image for more information
Problem Statement
The main goal of the project was to create an interactive dashboard for the Global superstore data set to find the total sales, profit & loss based on various features such as Country, Region, State, Year, product category, sub-category etc. to help in getting the business insights to take right decisions.
Solution
Advanced Excel was used to build this dynamic dashboard
for more details & other similar projects, please visit Tableau Public .
LinkedIn Profile

Hands-on experience in Python, Data Analysis, Machine Learning algorithms, Statistics, Time series forecasting, model training using Azure ML studio & understanding of complete ML pipeline, check out.
Medium

Contact Form
Elements
Text
This is bold and this is strong. This is italic and this is emphasized.
This is superscript text and this is subscript text.
This is underlined and this is code: for (;;) { ... }. Finally, this is a link.
Heading Level 2
Heading Level 3
Heading Level 4
Heading Level 5
Heading Level 6
Blockquote
Fringilla nisl. Donec accumsan interdum nisi, quis tincidunt felis sagittis eget tempus euismod. Vestibulum ante ipsum primis in faucibus vestibulum. Blandit adipiscing eu felis iaculis volutpat ac adipiscing accumsan faucibus. Vestibulum ante ipsum primis in faucibus lorem ipsum dolor sit amet nullam adipiscing eu felis.
Preformatted
i = 0;

while (!deck.isInOrder()) {
    print 'Iteration ' + i;
    deck.shuffle();
    i++;
}

print 'It took ' + i + ' iterations to sort the deck.';
Lists
Unordered
- Dolor pulvinar etiam.
- Sagittis adipiscing.
- Felis enim feugiat.
Alternate
- Dolor pulvinar etiam.
- Sagittis adipiscing.
- Felis enim feugiat.
Ordered
- Dolor pulvinar etiam.
- Etiam vel felis viverra.
- Felis enim feugiat.
- Dolor pulvinar etiam.
- Etiam vel felis lorem.
- Felis enim et feugiat.
Icons
Actions
Table
Default
| Name |
Description |
Price |
| Item One |
Ante turpis integer aliquet porttitor. |
29.99 |
| Item Two |
Vis ac commodo adipiscing arcu aliquet. |
19.99 |
| Item Three |
Morbi faucibus arcu accumsan lorem. |
29.99 |
| Item Four |
Vitae integer tempus condimentum. |
19.99 |
| Item Five |
Ante turpis integer aliquet porttitor. |
29.99 |
|
100.00 |
Alternate
| Name |
Description |
Price |
| Item One |
Ante turpis integer aliquet porttitor. |
29.99 |
| Item Two |
Vis ac commodo adipiscing arcu aliquet. |
19.99 |
| Item Three |
Morbi faucibus arcu accumsan lorem. |
29.99 |
| Item Four |
Vitae integer tempus condimentum. |
19.99 |
| Item Five |
Ante turpis integer aliquet porttitor. |
29.99 |
|
100.00 |